![]()
Dashboard
The system dashboard helps managers quickly grasp the overall performance of the customer experience measurement system. It includes a collection of charts that display key metrics about the system over different periods:
- The most recent week
- The most recent month
- The most recent year
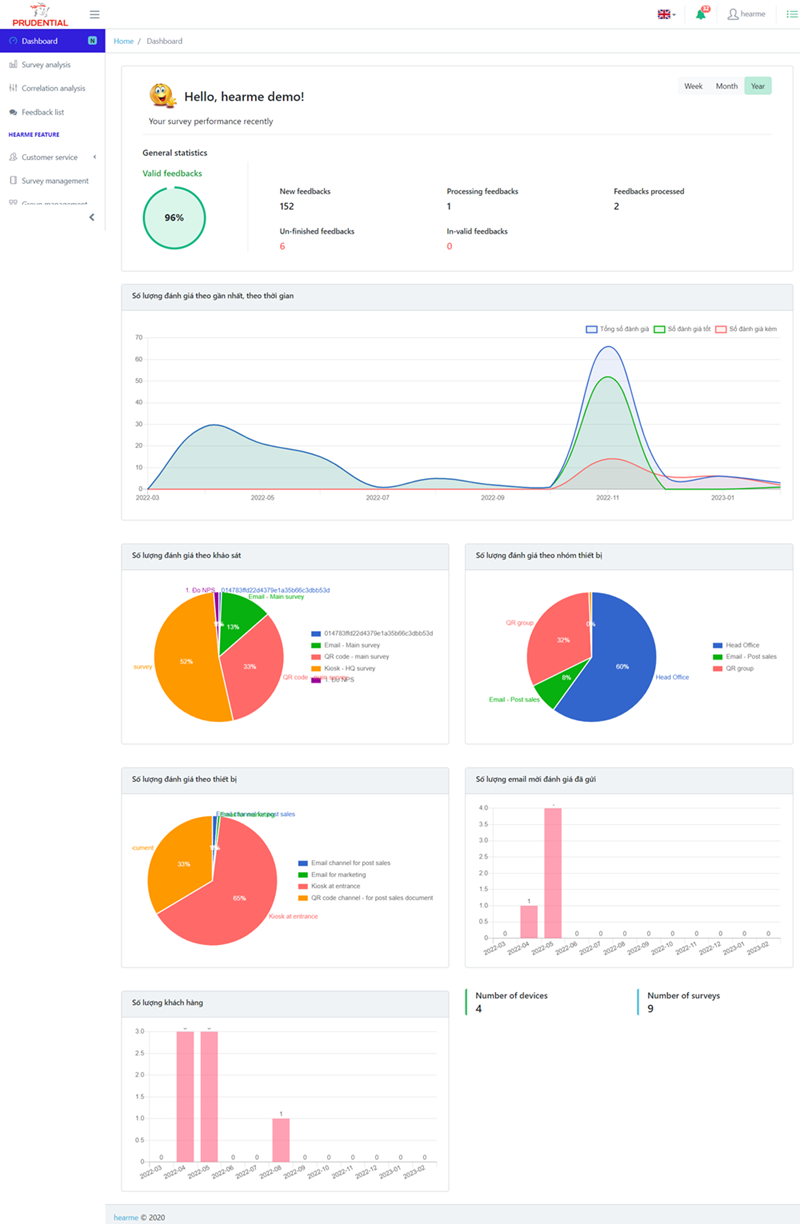
Dashboard Page
The dashboard page provides the following essential information:
- Review Count by Processing Status: Total valid reviews, new reviews, processed reviews, unprocessed reviews, invalid reviews, and incomplete reviews.
- Review Count by Score Range: Total reviews categorized by quality range (good, bad).
- Review Rate by Main Survey: Percentage of reviews based on the primary survey.
- Review Rate by Device Group: Percentage of reviews based on device groups.
- Review Rate by Device: Percentage of reviews based on individual devices.
- Review Count via Email Channel
- Number of Customers, Devices, and Surveys
This dashboard provides an overview of key performance indicators related to the system's customer experience measurement.
Survey Analysis
The survey analysis section compiles various types of reports based on data collected from customers. It includes an analysis of survey results and key metrics that businesses want to measure across different types of surveys on the HearMe system. The results are automatically analyzed and presented in charts for a visual overview.
In the analysis system, each type of survey is independently analyzed, and each survey type has different sets of charts for data analysis. Below are details about the charts for each survey type.
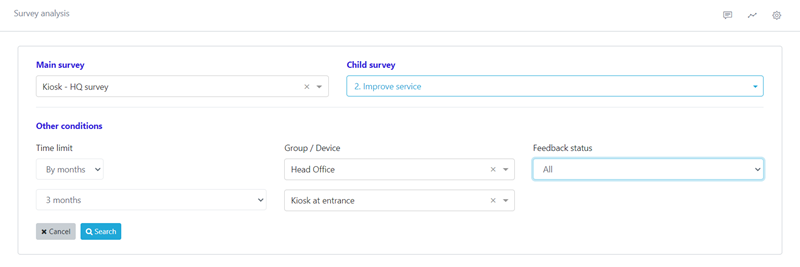
Report Data Filters
Survey Structure and Data Analysis
Surveys are the primary focus for viewing data analysis. The survey structure in the HearMe system is organized in a tree-like hierarchy. For detailed information, refer to the "Survey Configuration" section.
When analyzing data, the manager needs to choose the main survey and then select its components (nested within the main survey tree). The report results belong to the chosen survey component or the main survey (if no survey component is selected).
Users have various tools for filtering analytical data, as follows:
- Select Survey for Analysis: Choose the main survey (assigned to a device group) and survey components (nested within the main survey - organized in a tree structure).
- Choose Time Frame: Based on the number of recent days, recent months, or a specified time range.
- Filter by Device Group and Device.
- Filter by Feedback Status
Feedback status include: - Valid: Includes all new, processing, and processed reviews. - New - Processing - Processed - Invalid - Not Completed
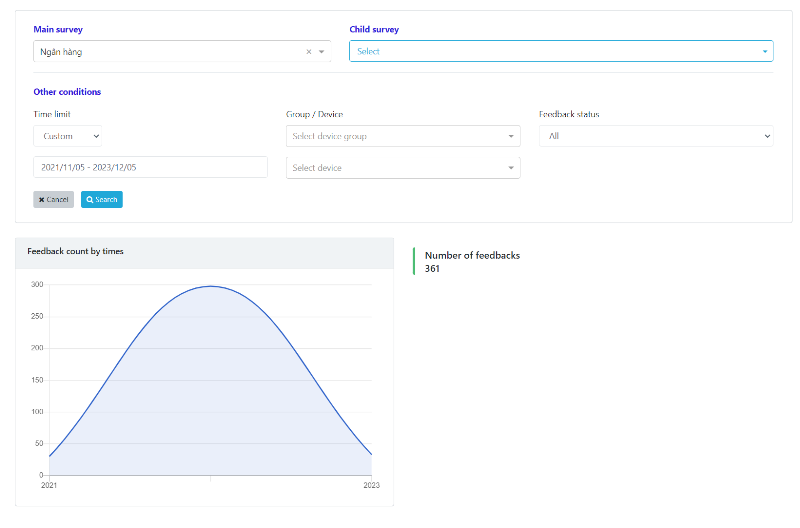
Principle of Displaying Time-Based Charts:
For charts representing measurements over time (Time sequence), the time unit will change according to the time filter.
- Time Filter by Day: The time unit will be days.
- Time Filter by Month: The time unit will be months.
- Custom Time Filter - Time Range: The unit will be based on the specified time interval.
There are three possibilities:
- If the time range is <= 30 days: Statistics will be presented on a daily basis.
- If the time range is <= 365 days: Statistics will be presented on a monthly basis.
- If the time range is > 365 days: Statistics will be presented on an annual basis.
Steps to View Reports:
- Step 1. Select the "Survey Analysis" menu.
- Step 2. Choose the main survey for which you want to view reports.
- Step 3. Select the "Survey Component" - a sub-survey within the main survey's tree structure.
- Step 4. Choose the filter parameters: time, device group, device, feedback status.
- Step 5. Click "Search" to display the report results.
Mixed Survey
This is a survey designed to link multiple sub-surveys together in a sequence. In the aggregated survey report, the total number of feedback received and a chart depicting the quantity of reviews over time will be displayed.
CSAT Index Report
This report includes the following:
- Total number of reviews
- Chart displaying the overall CSAT index over time.
- Percentage chart of the number of reviews for each customer satisfaction level.
- Feedback quantity chart over time.
- CSAT satisfaction index chart over time.
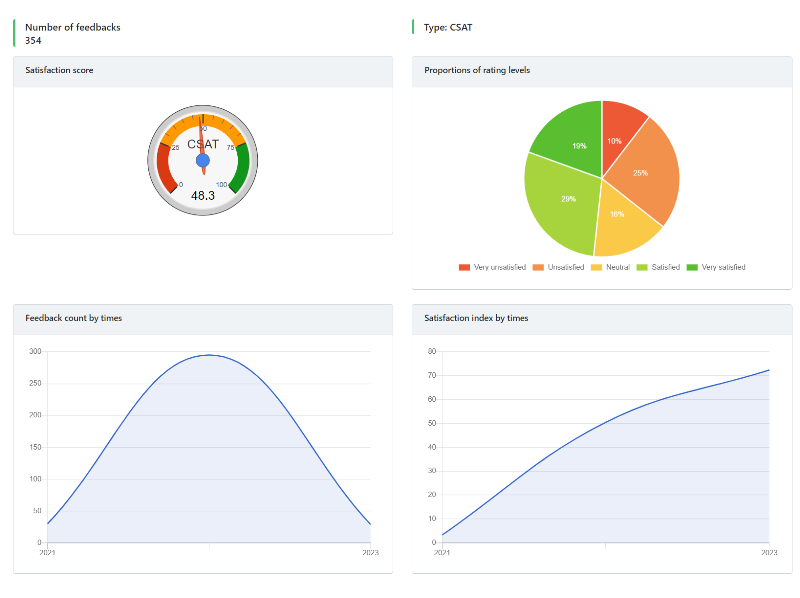
CSAT Satisfaction reports
NPS Index Report
This report includes the following:
- Total number of reviews
- Chart displaying the overall NPS index over time.
- Bar chart displaying the number of reviews for each customer satisfaction level.
- Feedback quantity chart over time.
- NPS index chart over time: Promoter (Positive), Detractor (Negative), and NPS (Net Promoter Score).
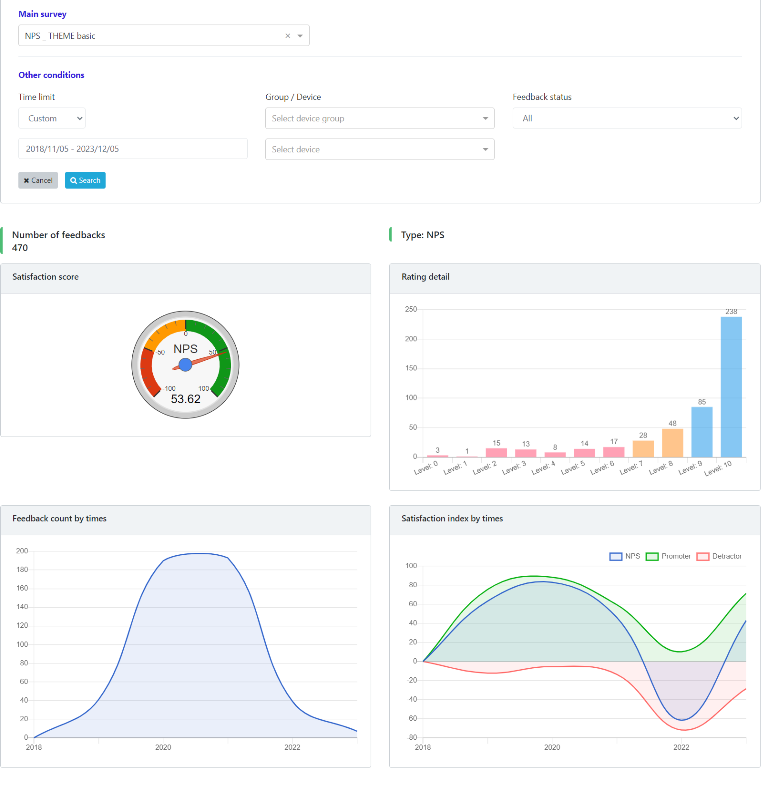
NPS Index Report
CES Index Report
This report includes the following:
- Total number of reviews
- Chart displaying the overall CES index over time.
- Bar chart displaying the percentage of reviews for each customer satisfaction level.
- Feedback quantity chart over time.
- CES index chart over time.
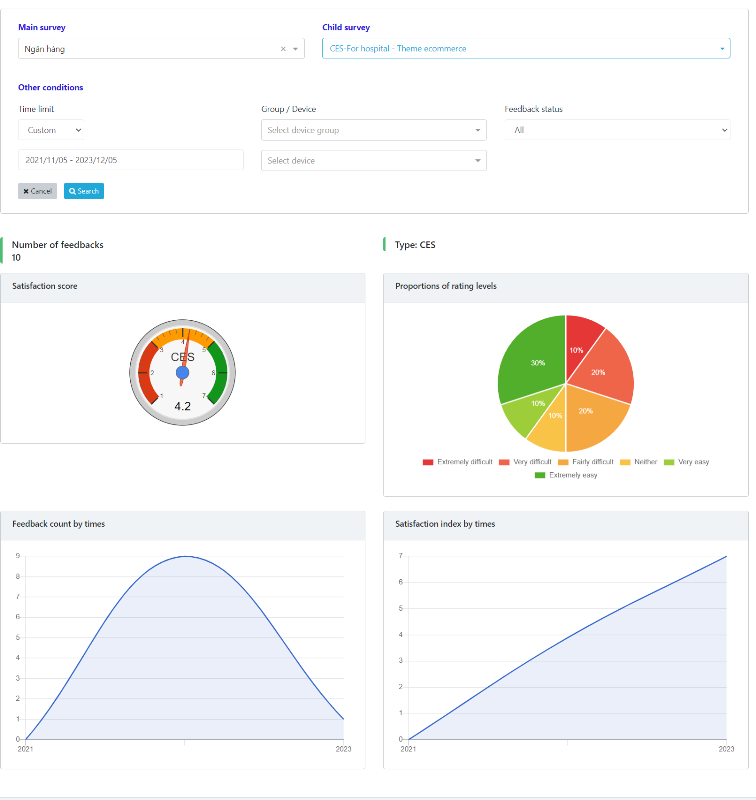
CES Index Report
FLX Index Report
This report includes the following:
- Total number of reviews
- Chart displaying the overall FLX index over time.
- Bar chart displaying the percentage of reviews for each customer satisfaction level.
- Feedback quantity chart over time.
- FLX index chart over time.
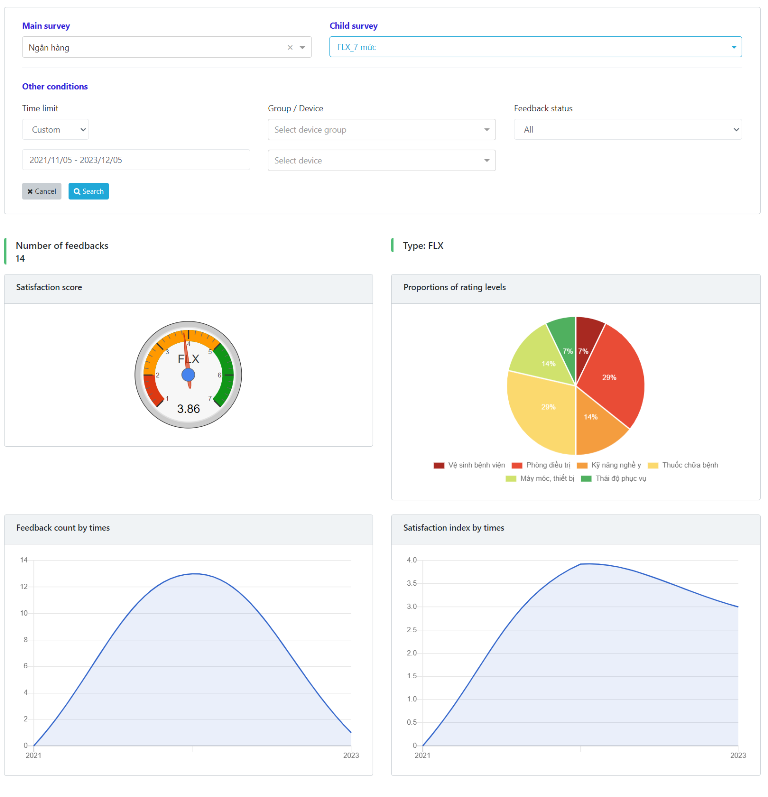
The FLX index is calculated as the average of various satisfaction levels, similar to the way the CES index is calculated. Additionally, it will also show the percentage (%) and quantity of different satisfaction levels.
Survey Multiple Choice
Includes the following reports:
- Total number of reviews
- Chart showing the percentage of reviews for each criterion over the total number of reviews
- Chart of the number of reviews for each criterion over time.
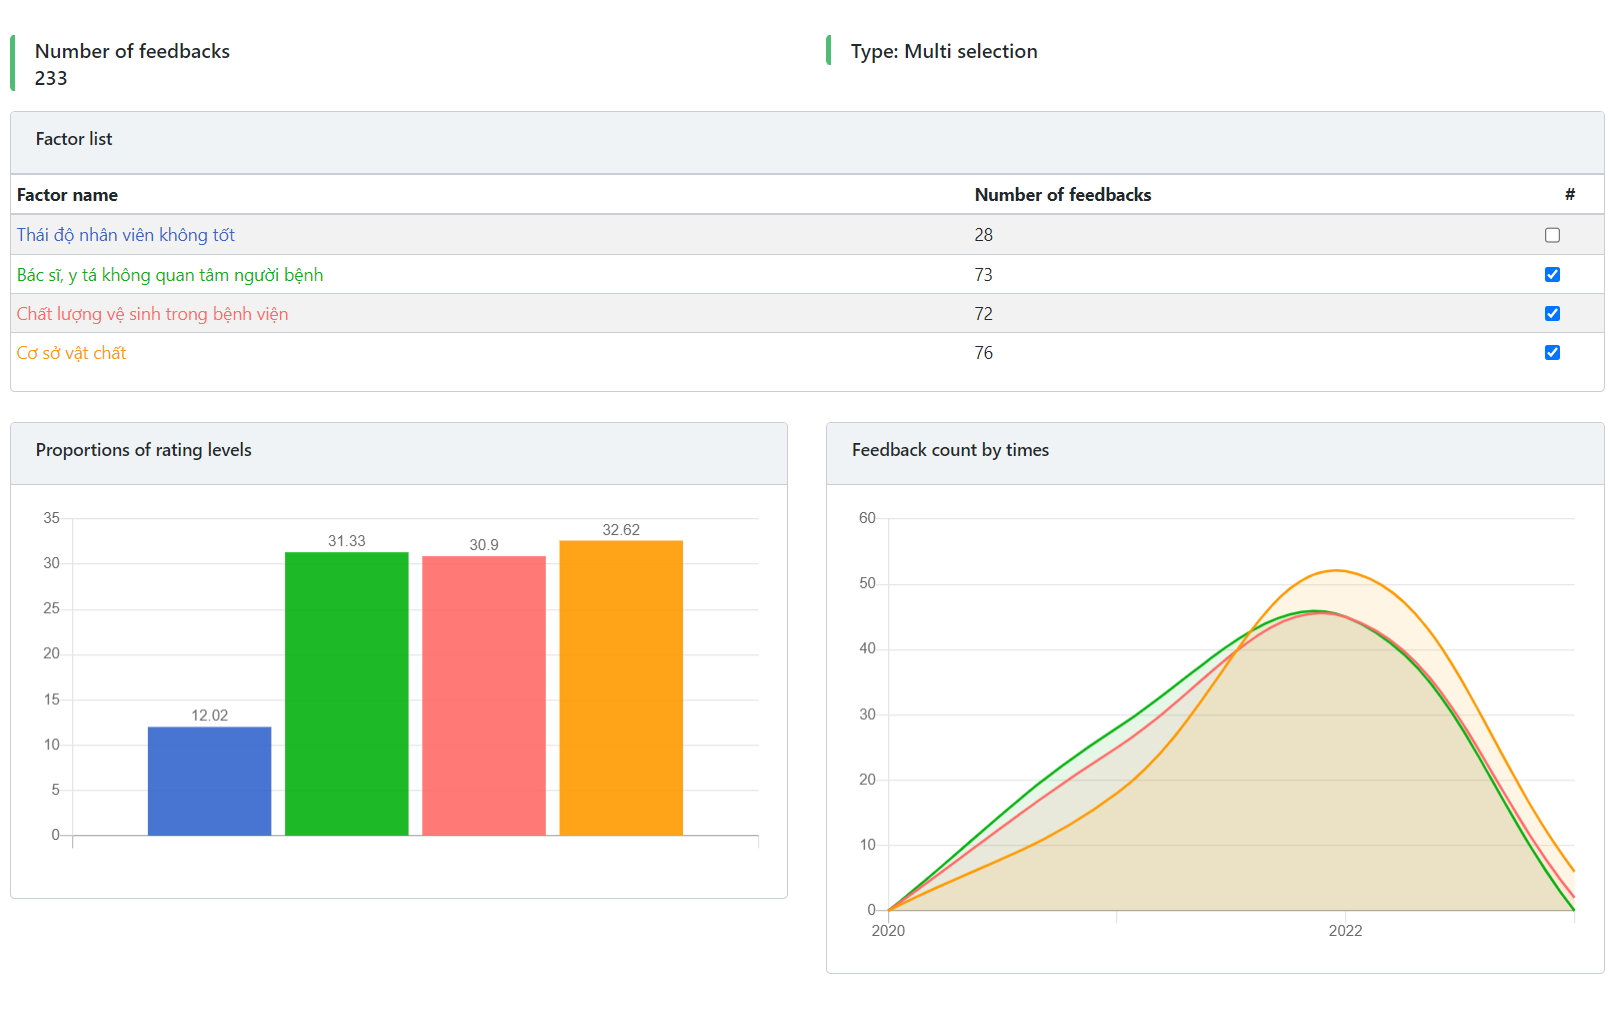
Multiple Choice Survey Report
Single Selection Survey
Includes the following reports:
- Total number of reviews
- Chart showing the percentage of reviews for each criterion over the total number of reviews
- Chart of the number of reviews for each criterion over time.
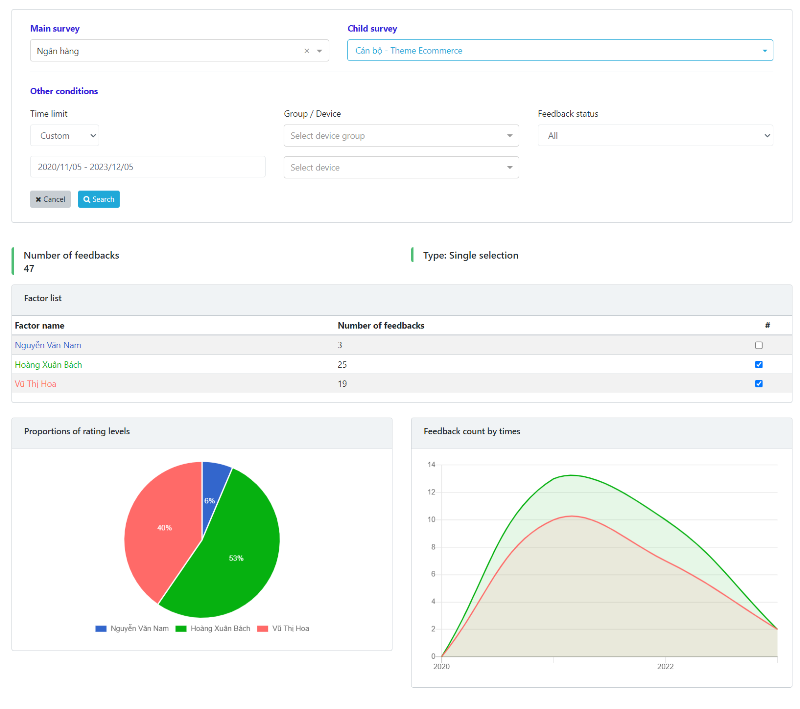
Single Selection Survey Report
The report will be displayed in the form of a pie chart, where the total customer choices add up to 100%. Each criterion is represented by a certain percentage.
5-Star Survey Report
Includes the following reports:
- Total number of reviews
- Chart showing the percentage of reviews for each 1-5 rating for each criterion.
- Chart showing the rating scores for each criterion (calculated as the average).
- Chart of the number of feedback over time.
- Chart of the scores for each criterion over time.
- The 5-star survey is a type of survey that allows customers to rate criteria on a scale of 5. One star corresponds to 1 point, with 1 star being the lowest and 5 stars being the highest.
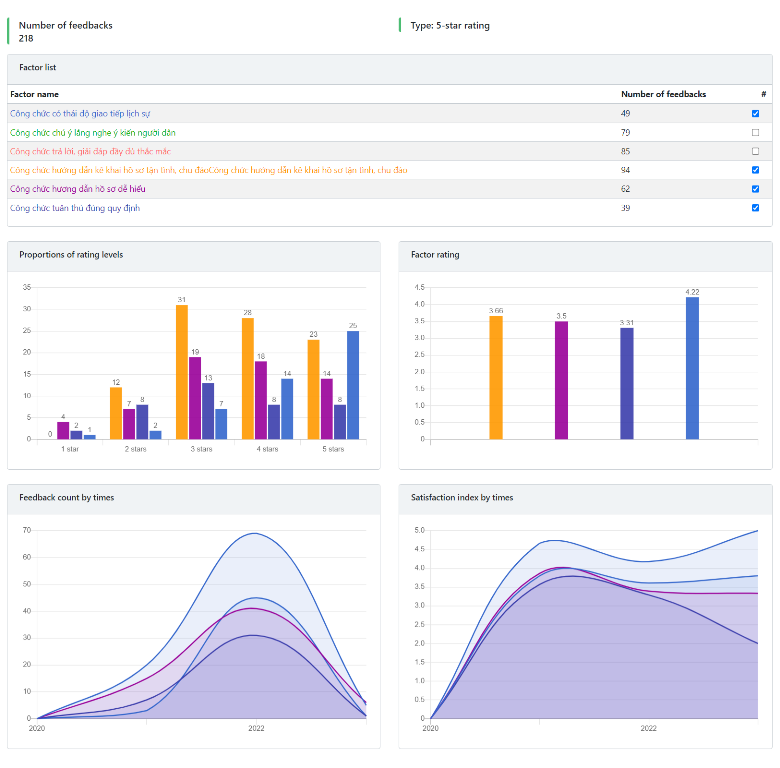
5-Star Survey Report
Other Survey Types
Applicable to various survey types:
- Form-based
- Open-ended question
- Contact information
- Attached file
The report content for these survey types is similar to the comprehensive survey mentioned above. The system only aggregates the number of reviews. Detailed review content for these surveys can be viewed in the "Feedback List" function.
Correlation Analysis
This is a type of analysis to understand the relationship between product quality criteria and customer satisfaction levels. Managers will gain the following information:
- How criteria affect satisfaction levels (positive correlation: direct correlation; negative correlation: inverse correlation)
- Degree of impact: from 0 to 1 (positive) and -1 to 0 (negative)
To view correlation analysis, in the admin interface, access the "Correlation Analysis" menu and perform the analysis steps as instructed on that page.
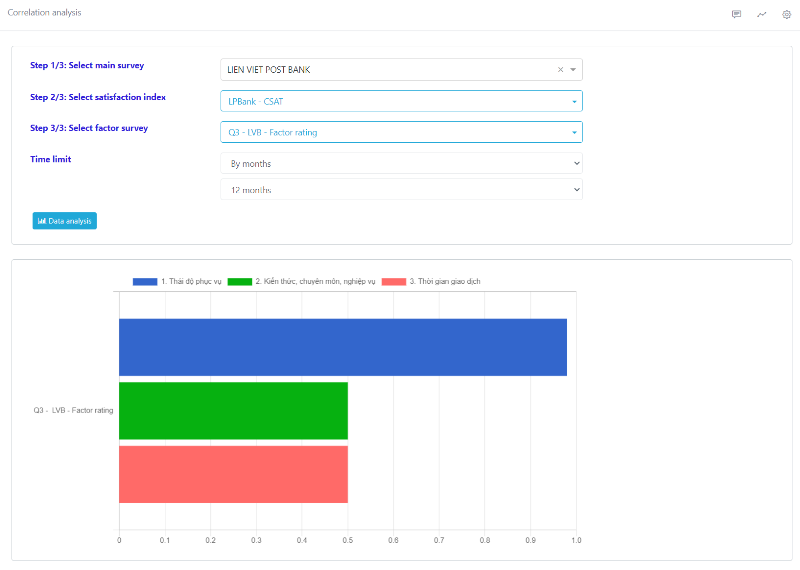
*Correlation Analysis
Extended Analysis
This is a specialized tool for displaying analyses and reports from the system. To configure the display of "Analysis plugins," access the "Report Plugin" section in "System setting".
After completing the configuration, access the "Analysis plugins" menu to view specialized reports directly on the hearme administration application.
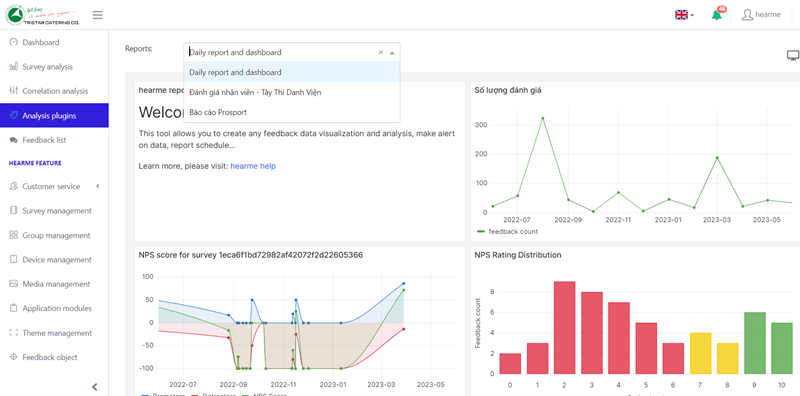
Extended Analysis
Feedback Content
Feedback List
The feedback list is a reporting section that displays a list of customer feedback for a specific survey. You can filter reviews based on various criteria such as device group or device, time, and status.
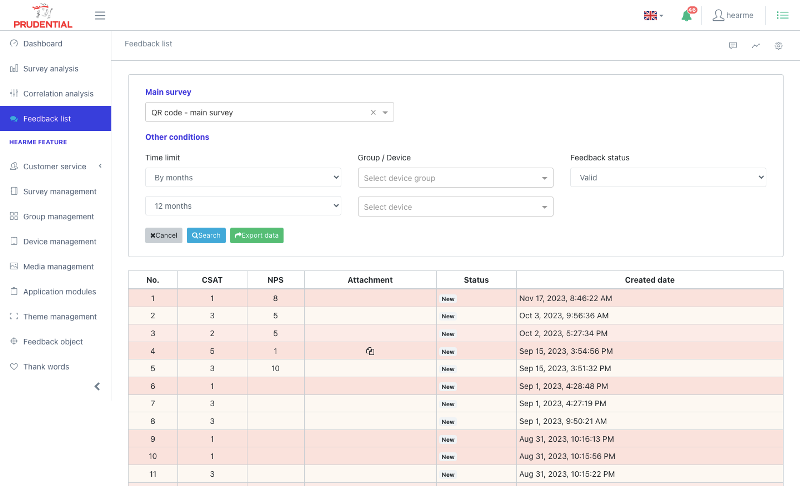
On this screen, the system will provide a concise display of important information for each review:
- Satisfaction scores
- Customer information (if available)
- Timestamp
- Status
- Attached data file
If any feedback has a score below the standard threshold, it will be highlighted with a bold color. The lower the satisfaction score, the darker the color of the review.
To view the details of each customer's feedback, click on the respective feedback entry.
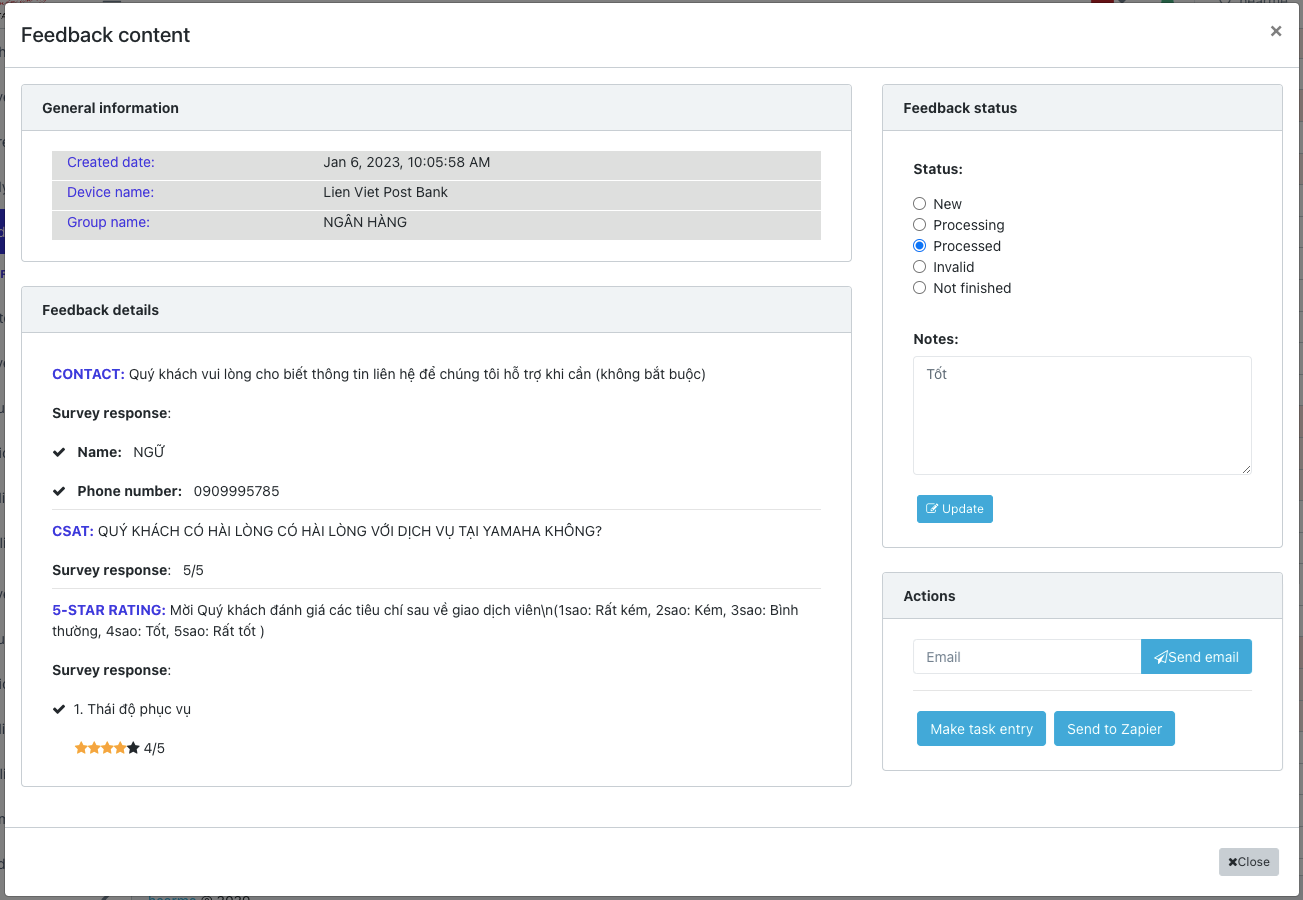
Here, each feedback will have a status:
- New: Newly created feedback.
- In Progress: After receiving feedback that requires processing, you can select "In Progress" to let managers know that someone has taken responsibility for this feedback.
- Resolved: When the issue has been resolved, you can update the status to "Resolved."
- Invalid: You can mark feedback as invalid if it's deemed unreliable. For example, test, incomplete, or other unreliable reviews. These reviews will not be included in survey statistical results.
- Not Completed: Feedback that customers have abandoned. You can either accept or discard such reviews.
In this interface, managers can perform the following necessary actions:
- Update description information for the review: processing details.
- Change the review status.
- Send review content to the relevant email for tracking purposes.
If the business has configured plugins to handle customer feedback data, these plugins will be displayed on this feedback detail page.
.
Exporting Excel Report
To download survey results to your computer in Excel format for review or reporting at a higher level:
- Step 1: Select "Feedback List"
- Step 2: Choose "Survey"
- Step 3: Select the time range for the report.
- Step 4: Choose the data filtering criteria.
- Step 5: Click on "Export Data"
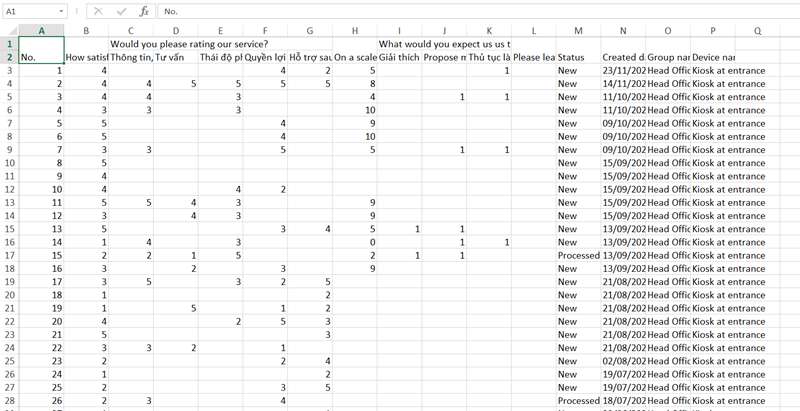
Sampele data from a excel file