![]()
With the Hearme system, you can implement customer satisfaction measurement using various indices, with a focus on three key indices widely applied:
CSAT - Customer Satisfaction Score
CSAT is a fundamental index measuring customer satisfaction, directly assessing customers' perceptions of products and services.
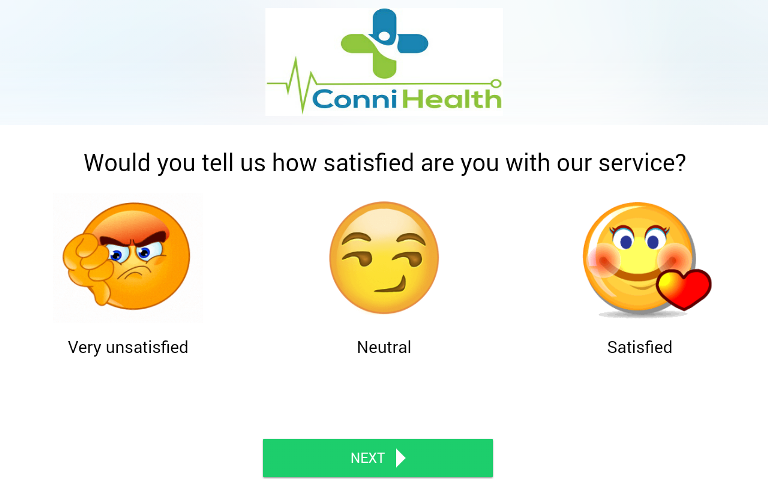
It is based on questions related to overall satisfaction or satisfaction with specific aspects such as products, services, or staff attitudes. Customers respond by selecting an emoji that corresponds to their emotions.
The five emojis correspond to scores from 1 to 5. The CSAT score represents the percentage of satisfied customers. Therefore, the satisfaction index is calculated as the percentage of customers who rate 4 or 5.
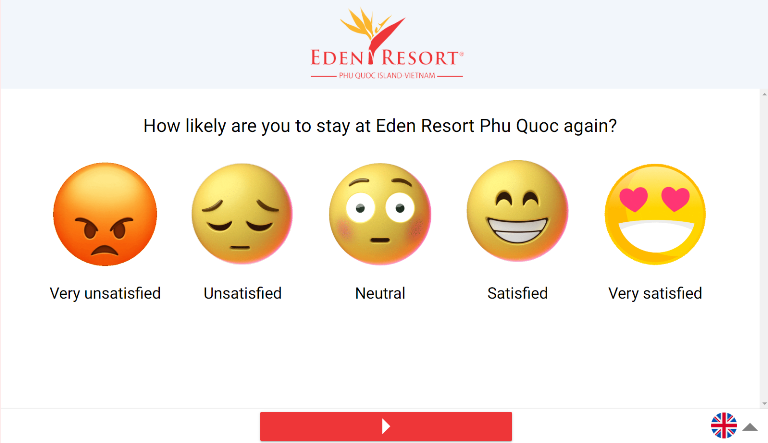
CSAT Survey Interface
CSAT Calculation Formula:
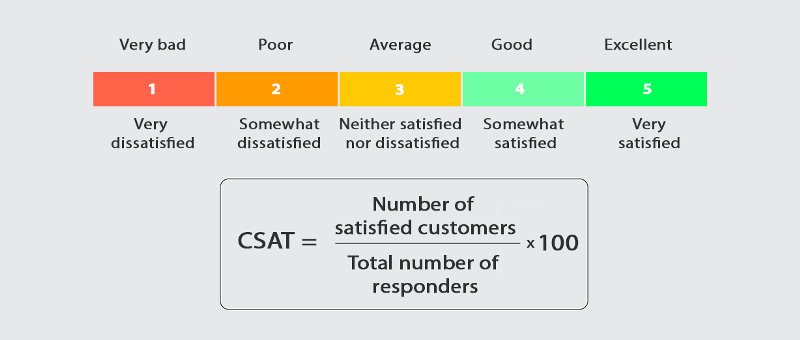
CSAT = (Number of Good Ratings + Number of Very Good Ratings) / Total Number of Ratings.
As illustrated by the emotional icons above, the CSAT score is determined.
Net Promoter Score (NPS)
The Net Promoter Score (NPS) is often referred to as the "Ultimate Question" and was introduced by Fred Reichheld in the Harvard Business Review in 2003. This score is widely used to measure customer loyalty.
The typical question asked for NPS is, "On a scale of 0 to 10, how likely are you to recommend Company A to your friends or colleagues?"
Customers choose a likelihood score to recommend your products or services to others, ranging from 0 (not likely at all) to 10 (extremely likely). NPS helps categorize your customers into three groups:
-
Promoters Group (9 – 10 points): Customers who rate the company from 9-10 are promoters. They have the highest repurchase rate and can refer up to 80% of new customers to the company.
-
Passives Group (7 – 8 points): "Satisfied but passive" customers, who rate the company from 7-8. They are more influenced by inertia than loyalty or enthusiasm, and they may leave the company if someone offers a better deal.
-
Detractors Group (below 6 points): Customers who rate the company from 0-6 are detractors. While some may bring profits to the company from an accounting perspective, their criticism and attitude can damage the company's reputation, discourage new customers, and demotivate employees.
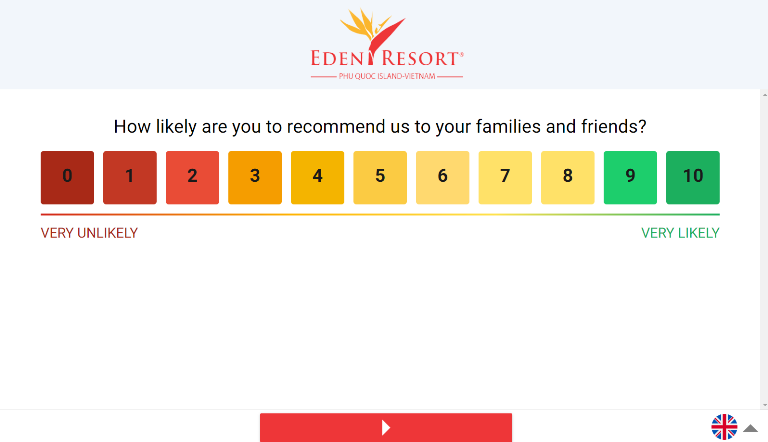
NPS Survey Interface
Customers will provide ratings within the range of 0 to 10, where 0 is the lowest score, and 10 is the highest. The score is measured by the percentage difference between the satisfied customer group (ratings from 9 to 10) and the dissatisfied customer group (ratings from 0 to 6). The passive customer group (ratings from 7 to 8) is not considered in the NPS calculation, as their feedback does not impact the NPS.
Therefore, the NPS score can range from -100 to 100. If your NPS score is below 0, it means that despite the business having profits, it is a bad net gain, indicating that the business is trying to sell but overlooking customer perceptions and experiences.
NPS Calculation Formula:
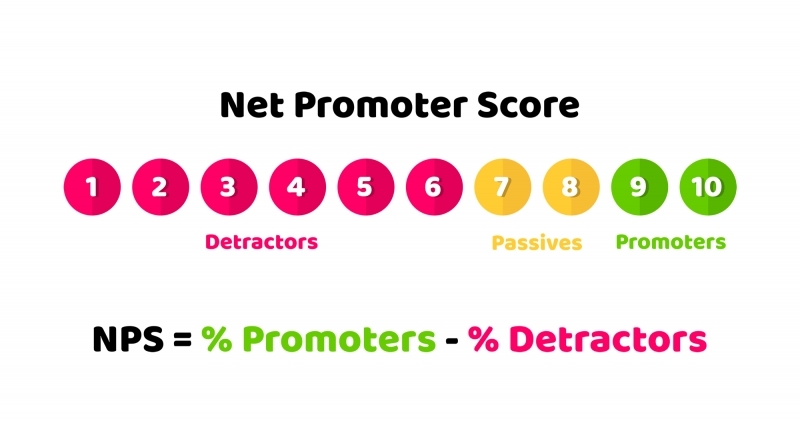
- Net Promoter Score (NPS) = % P (Promoters) – % D (Detractors)
Suppose you survey 100 customers, and there are 50 Promoters (50%), 25 Passives (25%), and 25 Detractors (25%).
NPS = 50% – 25% = 25%
In another scenario: In a survey of 100 customers, there are 30 Promoters (30%), 30 Passives (30%), and 40 Detractors (40%).
NPS = 30% – 40% = -10%
Customer Effort Score (CES)
Customer Effort Score (CES) identifies the pain points in a business. If your service is geared towards making it more convenient for customers, meaning making it easier for customers to access services or use products, then CES is an important metric.
A study published in the Harvard Business Review suggests that exceeding customer expectations incurs unnecessary costs and, in reality, does not correlate with increasing customer loyalty. What customers care most about and what is closely related to customer loyalty is the convenience of the business environment.
For example, with a question for customers like "Rate the process of placing an order on our website?" a business can understand where customers are struggling in their "journey." It can then provide solutions to improve those issues.
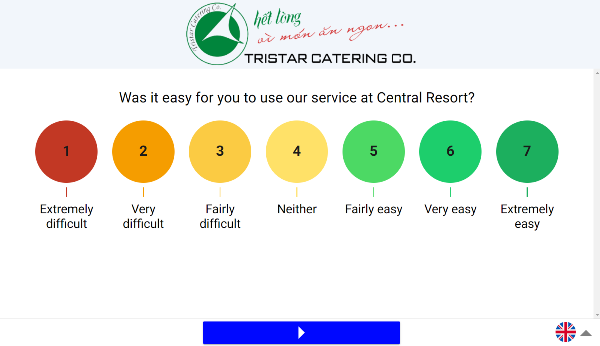
Survey interface for CES
CES Calculation:
CES is a customer-centric measure and usually asks only one question: "How much effort did you have to put forth to accomplish task B with our company?" On a scale from 1 to 7, where 1 is very difficult and 7 is very easy.
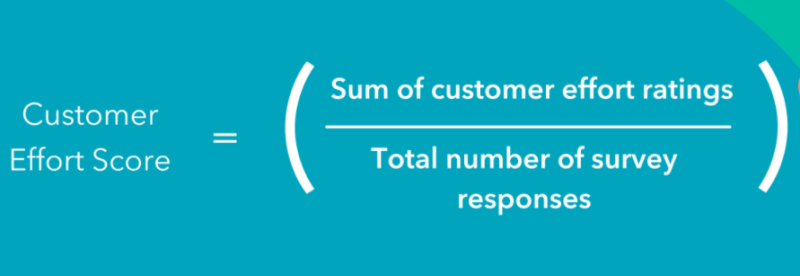
CES = Total score of evaluations / Number of evaluations.
When you survey the customer effort to make a purchase and you receive the following results: 5 customers give a score of 1, 7 customers give a score of 2, 8 customers give a score of 3, 10 customers give a score of 4, 15 customers give a score of 5, 20 customers give a score of 6, and 15 customers give a score of 7. Then your CES would be calculated as follows:
CES = (5x1+7x2+8x3+10x4+15x5+20x6+15x7)/(5+7+8+10+15+20+15) =383/80=4.7875
This CES score indicates that the purchasing process is average, not really easy for customers. You can further investigate to find and address the issues for improvement.
FLX index
FLX stands for Flexible, beyond the commonly used standard indices such as CSAT, CES, or NPS. If a business wants to create a survey with a rating scale ranging from 1 to 11, they can use FLX. This allows for different rating levels, such as 3, 4, or up to 11, providing flexibility in feedback.
Example of a 3-level FLX survey
In the survey statistics section, the FLX score will be calculated similarly to CES:
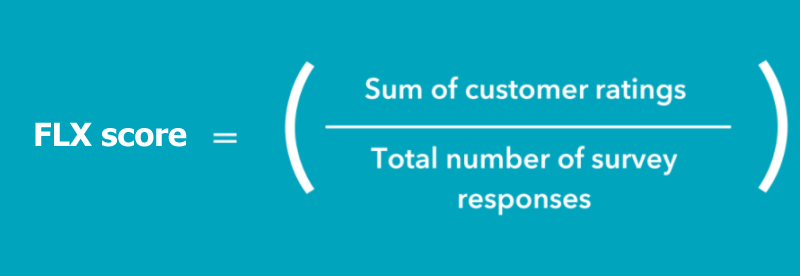
CES - FLX Calculation
For instance, using a 3-point scale, if there are 100 ratings at level 1, 300 at level 2, and 600 at level 3 in a month:
FLX = (100 * 1 + 300 * 2 + 600 * 3) / (100 + 200 + 600) = 2500 / 1000 = 2.5
Businesses can export survey data and use custom indices. For example, a business can use the FLX survey to measure the NPS on a scale from 0 to 10.